Questionable Research Practices (QRPs)
Overview
Teaching: 0 min
Exercises: 0 minQuestions
tbd
by eva

This week we learn some background and a few simple habits favoring reproducibility
How many false positive results are there?
What is p-hacking?
What is HARKing?
What is publication bias?
How to avoid/reduce these Qestionable Research Practices?
1. How many false positive results are there?
How many false positive results are there?
The goal of this first input is to understand the connection between the parameters of statistical testing procedures, i.e. level of significance and power, and the number of true and false positive results.
We use a completely hypothetical situation for that since one never knows in an empirical research situation if a true or a false positive result has been shown.
It is also important to note that null hypothesis significance testing procedures are not “symmetrical” in the sense that there may be evidence for a hypothesis (the smaller the p-value the stronger the evidence) but if there is a lack of evidence for the hypothesis one cannot conclude that it is false. Absence of evidence is not evidence of absence.
Moreover we assume in our hypothetical situation that 1 in 10 scientific hypotheses are true. This is an optimistic approach in itself.
Finally, there are many critiques of the null hypothesis significance testing procedure, e.g. the asymmetry between the restricted null hypothesis (effect is exactly zero) and the much larger alternative (effect is anything but zero). We do not enter this discussion here and hence our hypothetical situation is a gross simplification only considering this one approach to statistical investigation.
The epidemiology of studies
Scientific hypothesis:
There is an effect of a new treatment (an exposure, an intervention) in a specific population?
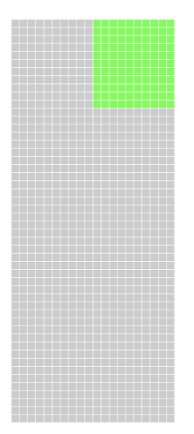
Assume: 1 in 10 scientific hypotheses are true.
⇒ Example: 100 of 1000 hypotheses are true, each square represents one hypothesis, the green ones are true the grey ones are false
⇒ 1000 statistical tests
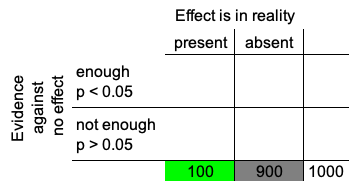
The epidemiology of studies
Calculate 1000 p-values
- p < 0.05: The evidence in the data is in favor of the hypothesis, i.e. of the effect being non-zero.
BUT: we do not know it’s true
- p > 0.05: There is not enough evidence in favor of the hypothesis.
BUT: we do not know it’s false
Absence of evidence is not evidence of absence!
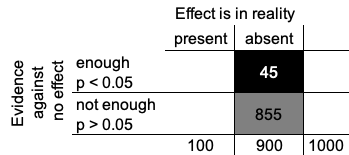
The epidemiology of studies
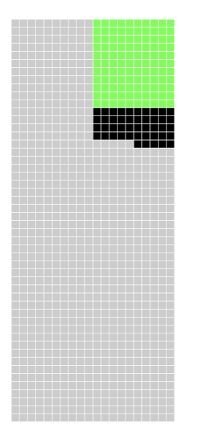
900 statistical tests of in reality wrong hypotheses
⇒ on average 5% false positive decisions
⇒ 900*0.05 = 45 incorrect decisions (black squares)
⇒ 900 - 45 = 855 correct decisions (grey squares)
The epidemiology of studies
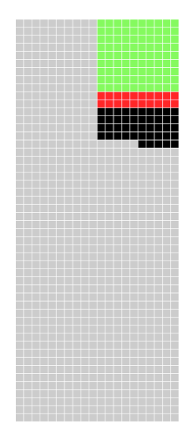
100 statistical tests of in reality true hypotheses
⇒ on average 20% false negative decisions (if power is set to 80%)
⇒ 100*0.2 = 20 incorrect decisions (red squares)
⇒ 100 - 20 = 80 correct decisions (green squares)
The epidemiology of studies
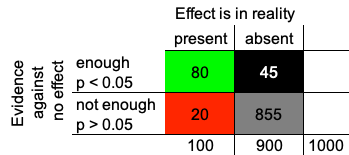
Green and black squares: 125 hypotheses are supposed to be true.
This is unreliable because:
Correct only for 80/125 = 64% of them! PPV
Grey and red squares: 875 hypotheses are supposed to be wrong.
This is reliable because:
Correct for 855/875 = 98% of them! NPV
The above explanations were partly inspired by the video by the Economist https://youtu.be/TosyACdsh-g
Statistical power
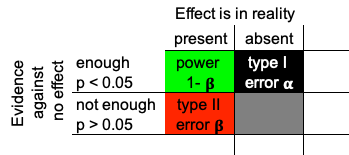
Power (1-β) in hypothesis testing is defined as the probability to detect an effect when there really is one. As statistical power increases, the probability of committing a type II error decreases.
Quiz on how many false positive results are there?
Quiz 4.1
If the power is set to 90% and you perform 100 statistical tests of in reality true hypothesis you will have on average how many incorrect decisions (red squares)?
- 20
- 10
- 80
- 90
Solution
F 20
T 10
F 80
F 90
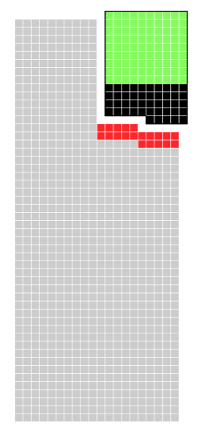
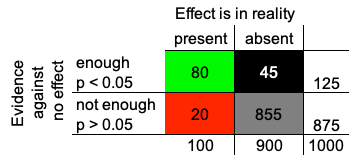
Quiz 4.2
The positive predictive value, PPV, in the epidemiology of studies of 100 in reality true hypotheses and 900 in reality wrong hypotheses, is based on the number of false positives (black squares) and true positives (green squares). For a power of 90% this number will be
- 125
- 135
- 875
- 865
Solution
F 125
T 135
F 875
F 865
2. What is p-hacking?
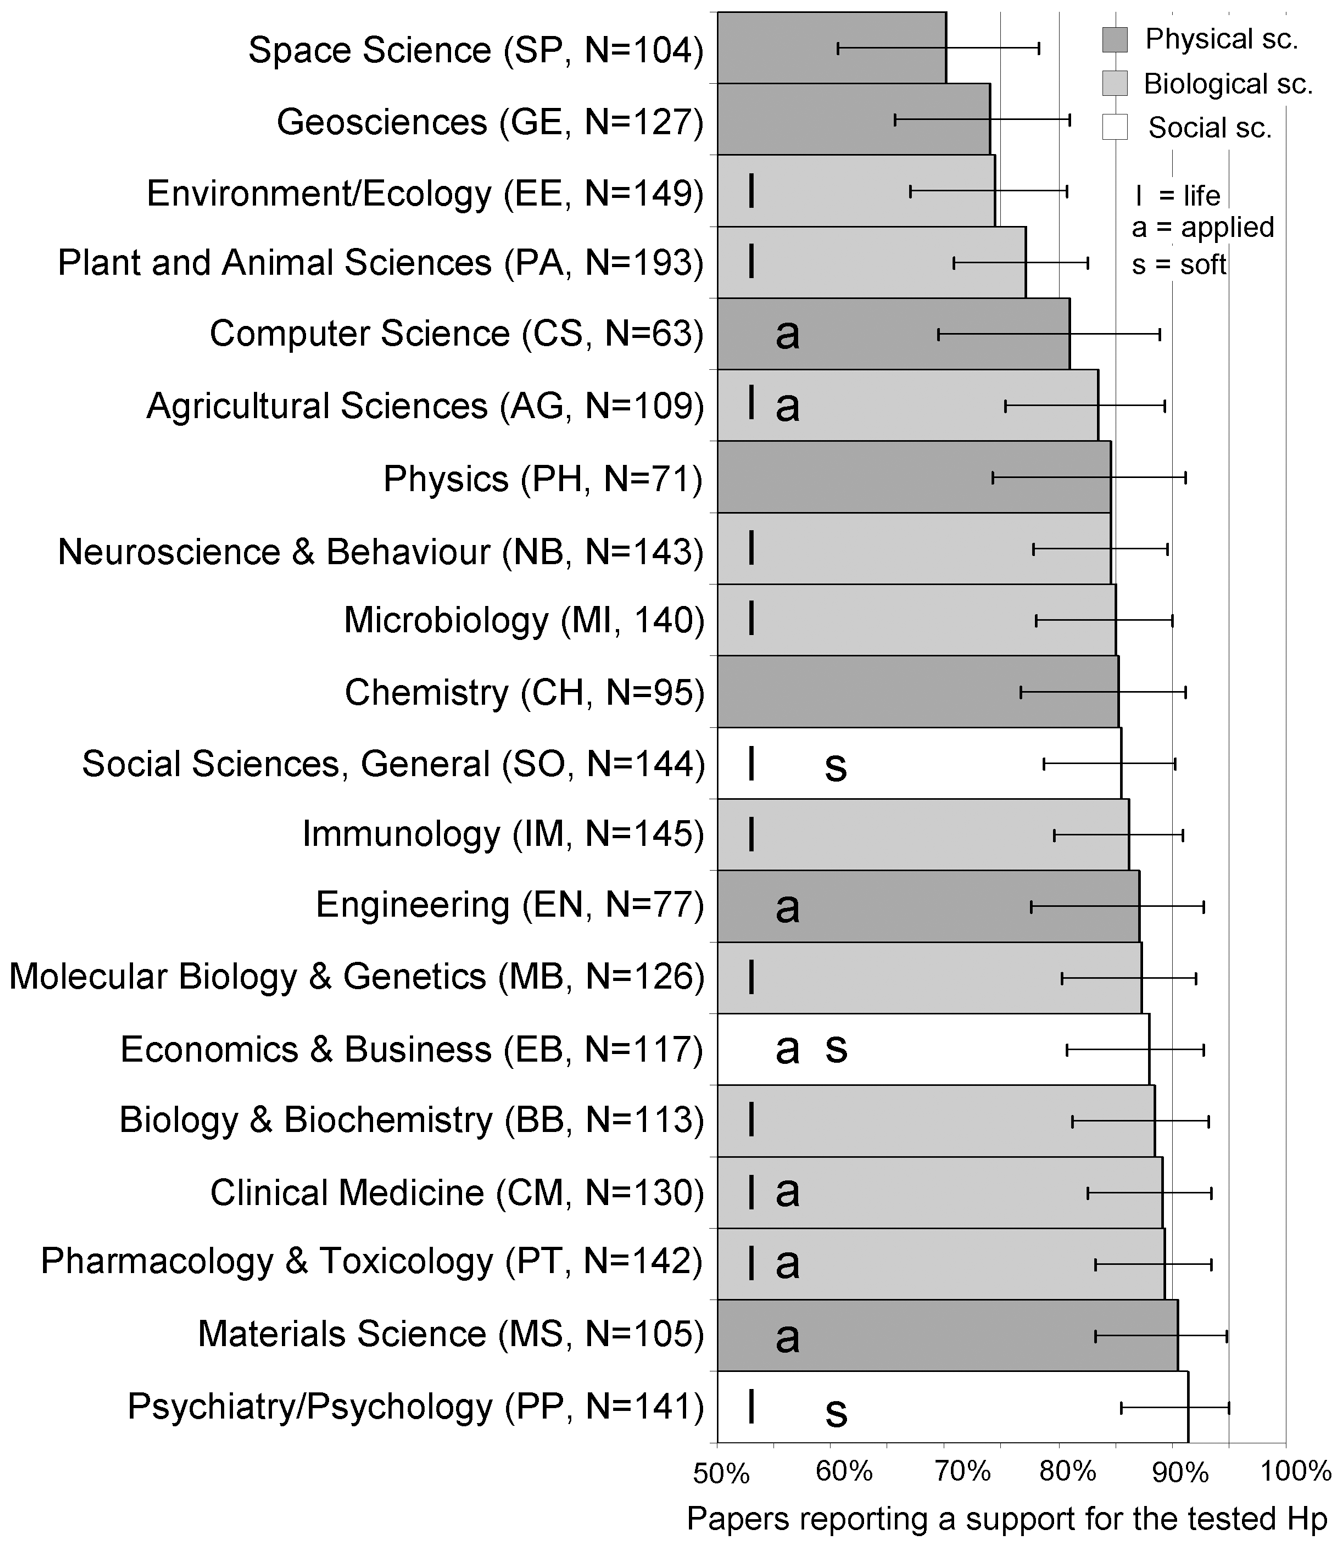
Positive results
In light of the epidemiology of studies how do you interpret these numbers?
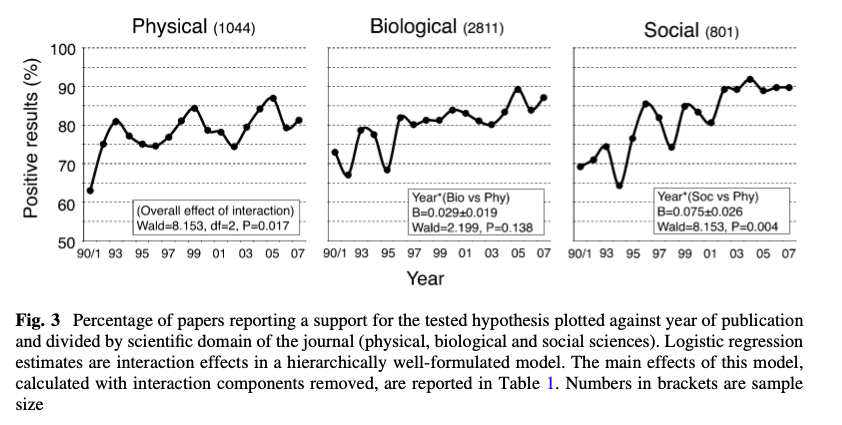
D Fanelli https://link.springer.com/article/10.1007/s11192-011-0494-7
p-hacking, a definition
p-hacking: Tune your data analysis in a way that you achieve a significant p-value in situations where it would have been non-significant. (F. Schönbrodt)
How could you tune your data analysis to get to a significant result?
- Outcome switching
- Selective reporting
- Sample until significance
- Uncorrected multiple testing
- Subgroup analyses
- Adapt your measurement process
Try this out with the shiny app by F. Schönbrodt http://shinyapps.org/apps/p-hacker/
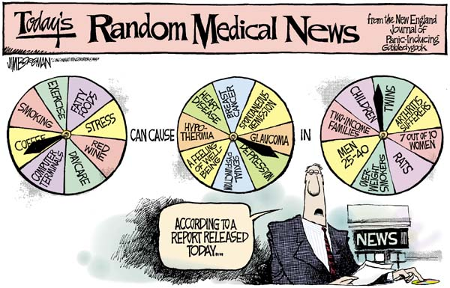
Example
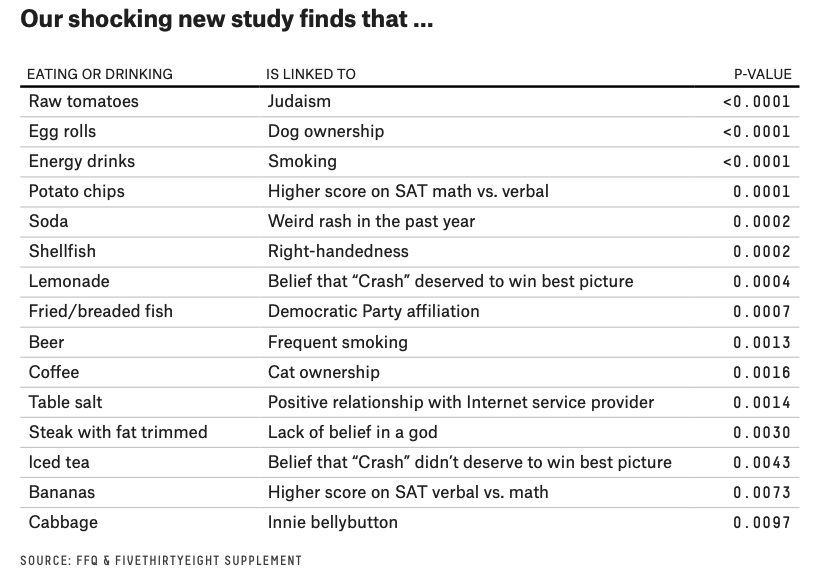
Read the fivethirtyeight article “You Can’t Trust What You Read About Nutrition” https://fivethirtyeight.com/features/you-cant-trust-what-you-read-about-nutrition/
The authors report on nutritional research and how it is in general done. They also perform a small study themselves, see the table of results “Our shocking new study finds that …” in the article.
Bingo
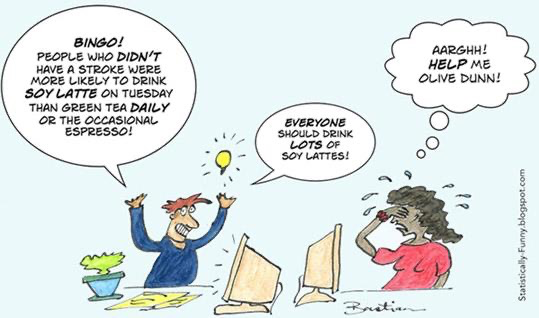
Image source: https://hildabastian.net/
Quiz on what is p-hacking?
Quiz 4.3
In a p-hacking perspective how could you tune your data analysis to get to a significant result?
- Outcome switching
- Complete reporting
- Pre-specified subgroup analysis
- Correct for multiple testing
Solution
T Outcome switching
F Complete reporting
F Pre-specified subgroup analysis
F Correct for multiple testing
3. What is publication bias?
Definition
Read the definition of publication bias in the Oxford University’s Catalogue of Bias.
Publication bias may be one explanation for the numbers in this graph:
D Fanelli https://journals.plos.org/plosone/article?id=10.1371/journal.pone.0010068
Example
In the article “Selective Publication of Antidepressant Trials and Its Influence on Apparent Efficacy” the authors obtained reviews from the Food and Drug Administration (FDA) for studies of 12 antidepressant agents involving 12,564 patients. They conducted a systematic literature search to identify matching publications.
Among 74 FDA-registered studies 38 were considered having a positive result by the FDA and 36 a negative result. The resulting publications were:
| Positive | Published | Not published | Published as positive | |
|---|---|---|---|---|
| yes | 37 | 1 | 38 | |
| no | 3 | 22 | 11 | 36 |
| 40 | 23 | 11 | 74 |
The studies in the column Published as positive were studies that were considered negative by the FDA but the resulting publication was phrased in a way that Turner and co-authors judged that the publication portrayed the study to have a positive result.
These numbers indicate that whether and how the studies were published was associated with the study outcome.
E Turner et al. https://www.nejm.org/doi/full/10.1056/nejmsa065779
Note: The terminology “positive” study refers in this specific situation to the antidepressant agent under study having a positive effect on the health outcome. A negative study could mean a null effect or a detrimental effect of the agent. This connotation is not appropriate in other situations and should be avoided.

File drawer problem

Image source: https://www.force11.org/blogs/nina-hedevang
Quiz on what is publication bias?
Quiz 4.4
A so-called negative study is
- A study where the effect of an intervention has a positive impact on a desirable outcome (e.g. a drug decreases the risk of disease)
- A study where no statistical significance was found
- A study where the effect of an intervention has a negative impact on a desirable outcome (e.g. a drug increases the risk of disease)
Solution
F A study where the effect of an intervention has a positive impact on a desirable outcome (e.g. a drug decreases the risk of disease)
F A study where no statistical significance was found
T A study where the effect of an intervention has a negative impact on a desirable outcome (e.g. a drug increases the risk of disease)
Quiz 4.5
Publication bias is the failure to publish the results of a study on the basis of the direction or strength of the study findings.
- Non-publication impacts the accuracy of evidence synthesis negatively.
- Non-publication has no impact on the accuracy of evidence synthesis.
- Non-publication impacts the accuracy of evidence synthesis positively.
Solution
T Non-publication impacts the accuracy of evidence synthesis negatively.
F Non-publication has no impact on the accuracy of evidence synthesis.
F Non-publication impacts the accuracy of evidence synthesis positively.
4. What is HARKing?
Definition
The term “HARKing” has been coined by Kerr in 1998:
“[…] when I refer to HARKing, I mean something more specific — presenting post hoc hypotheses in a research report as if they were, in fact, a priori hypotheses.”
N Kerr https://journals.sagepub.com/doi/10.1207/s15327957pspr0203_4
Cartoon by Jim Borgman, first published by the Cincinnati Inquirer and King Features Syndicate 1997 Apr 27; Forum section: 1
Example: Aspirin therapy in cardiac infarction patients
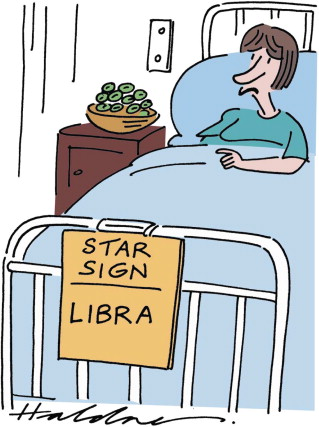
During the publication process of a randomized clinical trial among cardiac infarction patients of aspirin therapy vs. placebo the editors of the journal asked for 40 additional subgroup analyses to be added to the publication.
None of these analyses was pre-specified, but the authors agreed under the condition that they could add an additional subgroup analysis themselves.
The authors chose to use subgroups by zodiac sign of the patient, Gemini and libra vs all others and “showed” that for Gemini and Libra there is a slightly higher mortality in the aspirin arm compared to placebo, wheres for all other signs aspirin was significantly superior.
The authors concluded:
“All these subgroup analyses should, perhaps, be taken less as evidence about who benefits than as evidence that such analyses are potentially misleading.”
ISIS-2 Collaborative Group (1988) https://www.jameslindlibrary.org/isis-2-second-international-study-of-infarct-survival-collaborative-group-1988/
See also K Schulz and A Grimes https://www.thelancet.com/journals/lancet/article/PIIS0140-6736(05)66516-6
Strictly speaking this example shows no HARKing but it shows how it would be easy to arrive at a situation in which researchers are tempted to HARK and also how wrong this can easily be.
Example: The Chrysalis Effect: How Ugly Initial Results Metamorphosize Into Beautiful Articles
O’Boyle and co-authors systematically searched for dissertations in a management-relevant topic published between 2000 and 2012. They excluded dissertations that either were not from management or applied psychology departments or were not published in management or applied psychology journals as well as qualitative research, case studies, systematic reviews (i.e., meta-analyses), and dissertations that lacked formal hypotheses.
They systematically searched for the corresponding publications and identified 142 dissertations where there was overwhelming evidence that it had been subsequently published in a refereed journal.
Then the hypotheses of dissertation and publication were coded using two raters, again a systematic process allowing to observe if and how the hypotheses changed from dissertation to publication. Here is what they found:
“Across both the dissertations and journal articles, we recorded 2,311 hypotheses. The dissertations tested 1,978 hypotheses and their corresponding publications tested 978 hypotheses, a net change of 1,000. There were 645 common or retained hypotheses that remained essentially unchanged from dissertation to journal article. Of these common hypotheses, 373 were supported in the dissertation (57.8%, a ratio of supported to unsupported hypotheses of 1.37:1), and 412 were supported in the journal article (63.9%, a ratio of supported to unsupported hypotheses of 1.77:1).”
“If the Chrysalis Effect were present, then changes to data, variables, and boundary conditions would more likely affect the 272 unsupported dissertation hypotheses than the 373 supported dissertation hypotheses. […] Among the dissertation hypotheses not supported with statistical significance, 56 of 272 (20.6%) turned into statistically significant journal hypotheses as compared to 17 of 373 (4.6%) supported dissertation hypotheses becoming statistically nonsignificant journal hypotheses.”
O’Boyle et al. https://journals.sagepub.com/doi/abs/10.1177/0149206314527133

Quiz on what is HARKing?
Quiz 4.6
If you were a cardiac infarction patient and you were of zodiac sign Gemini or Libra would you rather
- receive aspirin therapy?
- receive no aspirin therapy?
- receive a daily horoscope?
Solution
This is not a serious question! From the example we saw in the course you are not able to infer if aspirin therapy seems to be beneficial or not. But it is clear that the zodiac sign has no influence. disease)
Quiz 4.7
Preregistration can be a solution to problems with QRPs because
- HARKing becomes much harder (but still possible)
- it helps avoid researcher bias, i.e. bias due to enthusiasm for the project
- it renders the research record more complete (e.g. in case there is no publication)
- it provides a control mechanism for universities on their researchers
Solution
T HARKing becomes much harder (but still possible)
T it helps avoid researcher bias, i.e. bias due to enthusiasm for the project
T it renders the research record more complete (e.g. in case there is no publication). F it provides a control mechanism for universities on their researchers
5. How to avoid/reduce these Questionable Research Practices?
Code of conduct for scientific integrity

Recall:
“Reliability, honesty, respect, and accountability are the basic principles of scientific integrity. They underpin the independence and credibility of science and its disciplines as well as the accountability and reproducibility of research findings and their acceptance by society. As a system operating according to specific rules, science has a responsibility to create the structures and an environment that foster scientific integrity.”
From the code of conduct it is clear that p-hacking, non-publication of so-called negative or null results and HARKing are questionable research practices (QRP). We will discuss some strategies to avoid them:
- why study (pre)-registration is important
- where and how to register a study
- why appropriate reporting is important and how to achieve it
See also the General Resources and Approaches course.
(Pre)- Registration
Preregistration is a time-stamped read-only research protocol created before the study containing as a minimum:
- Hypotheses
- Description of population, inclusion/exclusion criteria, sample size
- Data collection procedure or database used
- General design
- Variables (primary vs. secondary, explanatory vs. dependent variables, raw vs manipulated variables)
- Specification on how the key confirmatory analyses will be conducted under all probable scenarios
Why should you (pre)-register your study?
- Adds credibility to research
- Sets a time-stamped record of ideas
- Let’s researchers think more deeply about research and planning
- Helps remember your exact a-priori hypotheses
- Can save a lot of time
- Documents research and career
- Allows study to be included in meta research projects
Where to register?
Clinical trials, registry for clinical trials since 1997 https://clinicaltrials.gov/
OSF, embargo possible for up to 4 years https://osf.io/
aspredicted.org, protocols can be private forever https://aspredicted.org/
Preclinical trials, comprehensive listing of preclinical animal study protocols https://preclinicaltrials.eu/ See the General Resources and Approaches course for more examples.
Challenges of (pre)-registration
- Changes regarding data collection (e.g., less observations)
- Violation of statistical assumptions, e.g. distribution of variables
- Possible variables unknown until we actually get the data
- Many experiments, large datasets, i.e. discovery science
- Can somebody scoope me?
Solutions: challenges of (pre)-registration
Changes regarding data collection (e.g., less observations) Solution document changes to procedures and data acquisition such that it is possible to assess their impact.
Violation of statistical assumptions, e.g. distribution of variables Solution pre-register decision tree
Possible variables unknown until we actually get the data Solution look at meta-data or subset of full data for the analysis plan
Many experiments, large datasets, i.e. discovery science Solution Initial experiment exploration, follow-up experiment for confirmation
Can somebody scoope me? Solution Set embargo, registration is time-stamped
And when writing the article?
- Include link to your (pre)-registration ⇒ increase credibility and facilitate meta research
- Report the results of all (pre)-registered analyses
- Any unregistered analysis must be transparently reported
Registered reports
Two stage review
First stage: protocol with hypotheses, methods and analysis plan is reviewed
⇒ in-principle acceptance
Second stage: Authors resubmit after completion of study incorporating first-stage review recommendations, paper is quality-controlled before publication
⇒ it does not matter any more if effects are significant or not!
Dozens of journals already implemented RR: Cortex, BMJ Journals, Nature Hum Behav., eNeuro, etc., see https://cos.io/rr/
Preregistration shows an effect (for RR)**
Preregistration and RR are becoming more frequent
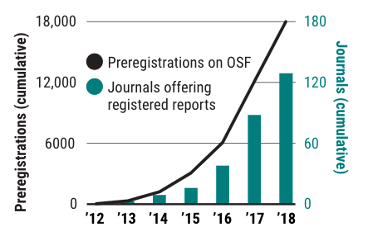
K Kupferschmidt https://www.science.org/doi/full/10.1126/science.361.6408.1192
Sharp rise in null findings in the registered report (RR) setting
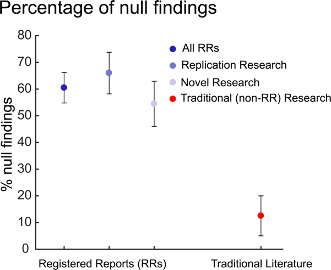
C Allen and D Mehler https://journals.plos.org/plosbiology/article?id=10.1371/journal.pbio.3000246
Reporting guidelines
- Simple, structured tool to use while writing manuscripts.
- Providing a minimum list of information needed to ensure a manuscript can be, for example:
- understood by a reader
- replicated by a researcher
- used by a doctor to make a clinical decision
- included in a systematic review
- Guiding authors in reporting a specific type of research
- Developed using explicit methodology
Examples:
- Equator network http://www.equator-network.org/about-us/what-is-a-reporting-guideline/
- M McLeod et al. https://www.pnas.org/content/118/17/e2103238118
- M Appelbaum et al. https://doi.apa.org/fulltext/2018-00750-002.html
See the General Resources and Approaches course for more examples.
Items from JARS
Journal Article Reporting Standards for Quantitative Research in Psychology: The APA Publications and Communications Board Task Force Report (JARS), M Appelbaum et al. https://doi.apa.org/fulltext/2018-00750-002.html
JARS contains a very detailed list of reporting items for several types of studies in psychological research. It starts with a flow chart distinguishing between cases.
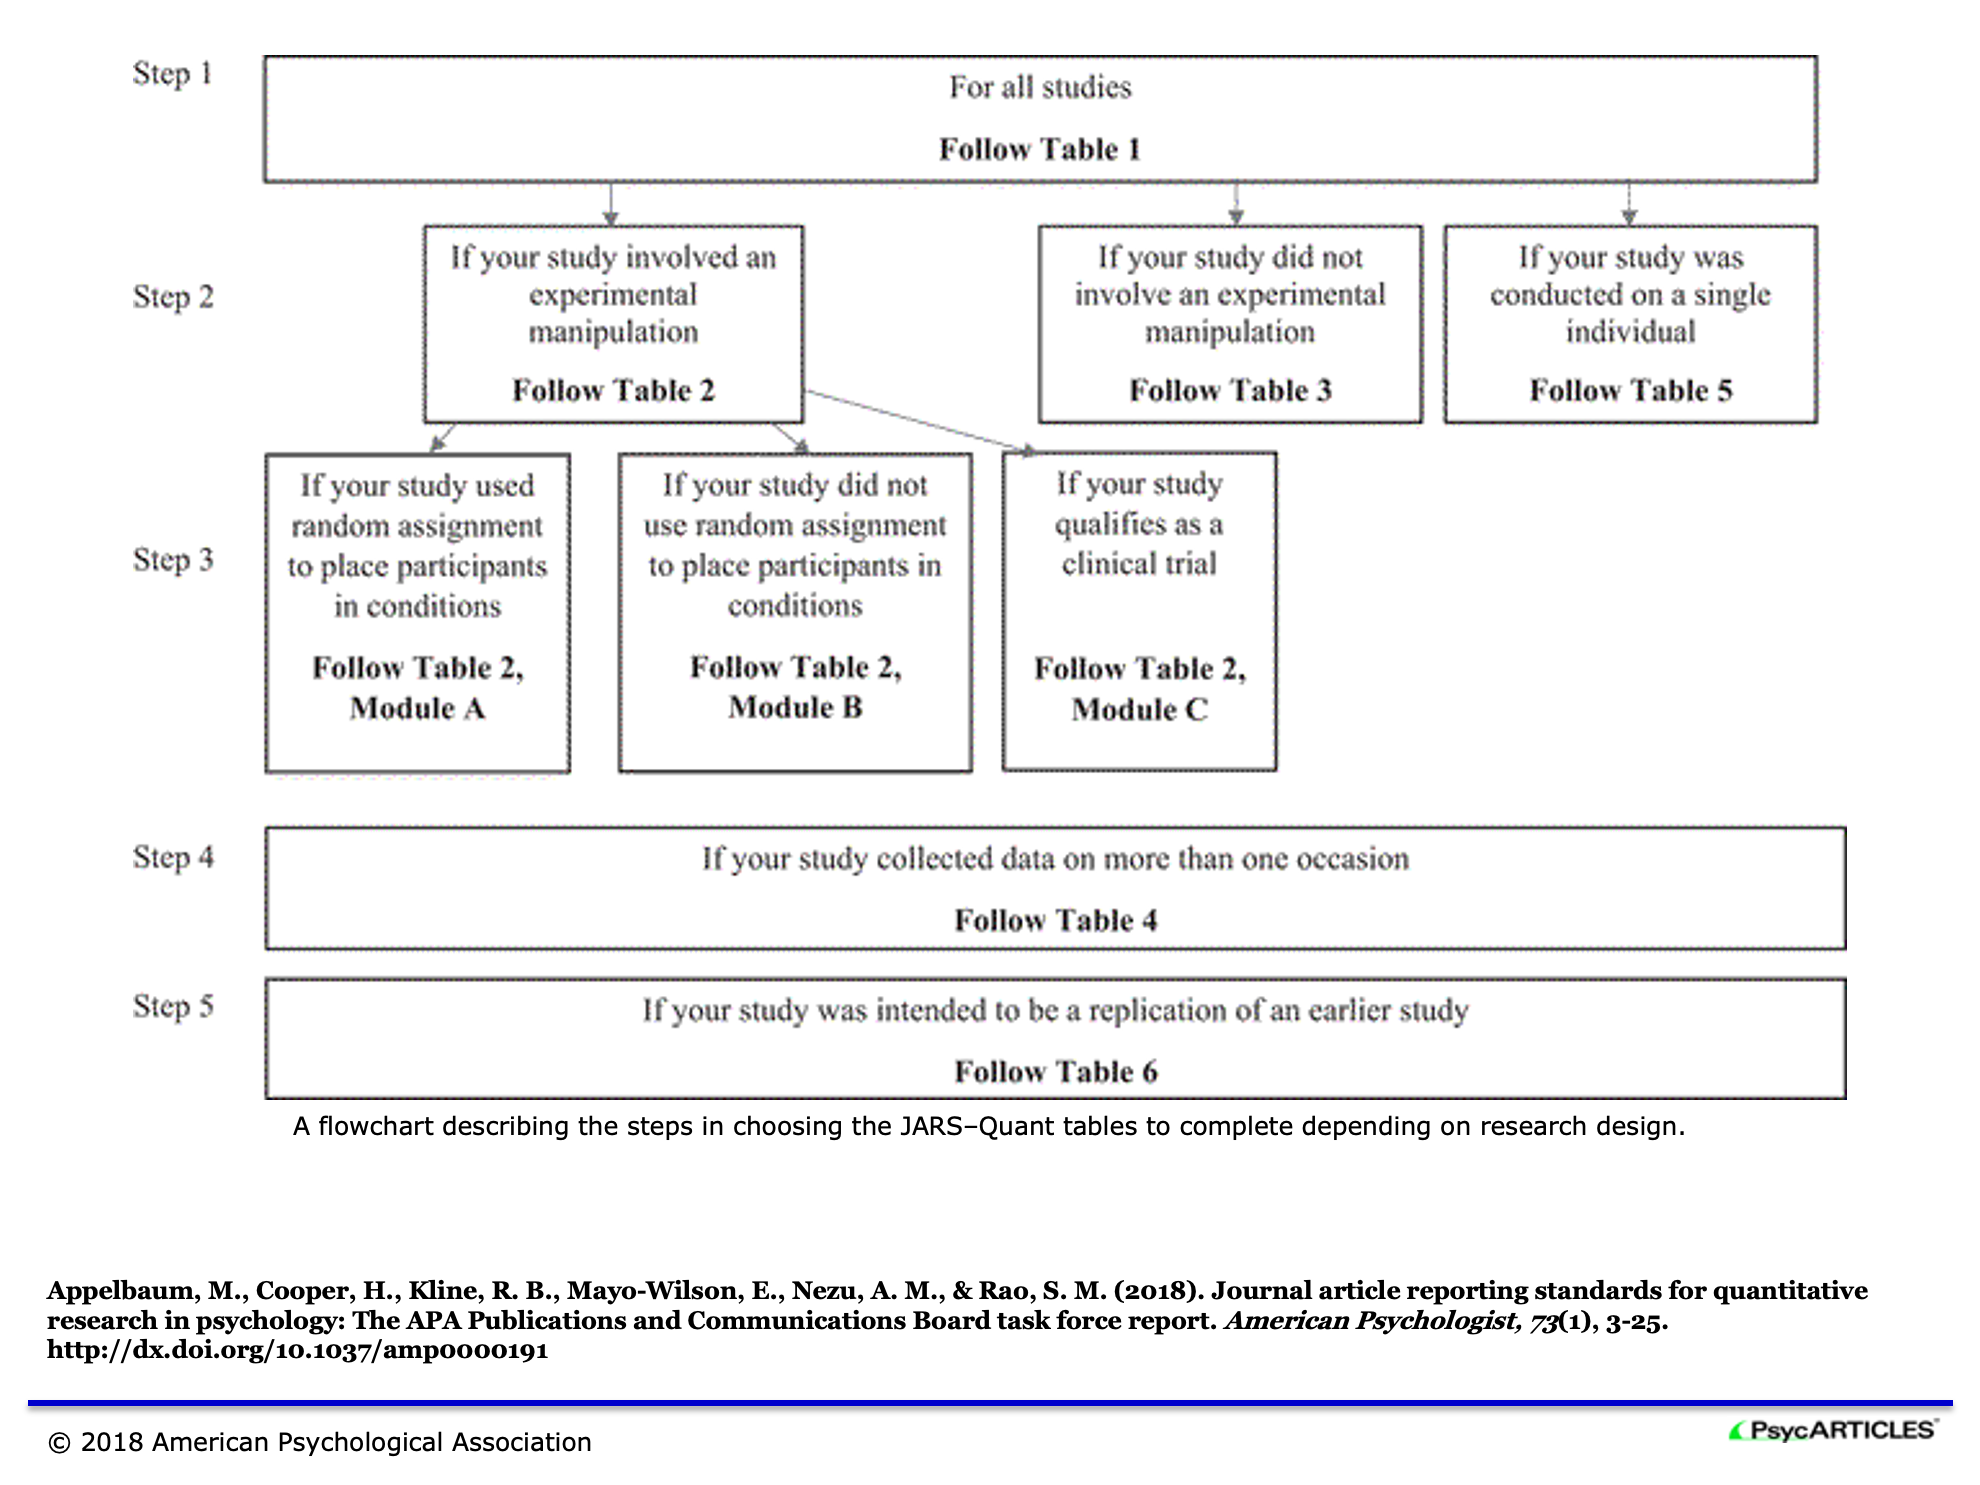
Below is the start of the general reporting item list, no matter what exact study type. Look at some examples, e.g. for the abstract and the section describing the methods. For more information see the entire article.

Quiz on how to avoid/reduce these Questionable Research Practices?
Quiz 4.8
Reporting guidelines can be a solution to problems with QRPs because
- following them guarantees a high quality study
- being required to follow them makes selective reporting harder
- using reporting guidelines already at the outset raises awareness of good practice
Solution
F following them guarantees a high quality study
T being required to follow them makes selective reporting harder
T using reporting guidelines already at the outset raises awareness of good practice
Homework
We will work on the data collected for the fivethirtyeight article “You Can’t Trust What You Read About Nutrition” https://fivethirtyeight.com/features/you-cant-trust-what-you-read-about-nutrition/
The complete data that were produced are available here along with analysis code: https://www.kaggle.com/fivethirtyeight/fivethirtyeight-nutrition-studies-dataset
Read in the p-values that have been calculated for the article. Note that there is an error in one name of an FFQ variable.
# load the results of the original analysis
pvals_orig <- read.csv(here::here("files/docs/04/data/p_values_analysis.csv"))
pvals_orig$food[ is.na(pvals_orig$food)] <- "BREAKFASTSANDWICHFREQ"
Prepare an Rmd file providing solutions for the following tasks. Name the file Homework_03.Rmd and place it in the homework directory, i.e. homework/Homework_03.Rmd. Using exactly these file and directory names is important for automated testing of your submission. If you you do not adhere to these instructions the homework will be considered to be not handed in. Make sure your code is visible in Homework_03.html.
Task 1
Assuming that 10% of the performed regressions are quantifying “true” associations and that the sample size of 54 corresponds to a power of 60% (which is extremely wishful thinking) calculate the (hypothetical) positive predictive value in this situation. Assume a significance level of 5%.
Task 2
How many positive decisions have been taken at the 5% significance level? How many are hypothetically really true under the parameters of Task 1?
Task 3
Take the association between cat ownership cat and coffee consumption COFFEEDRINKSFREQ and fit the corresponding linear model (see the results table in the article). What is the estimated coefficient for the association and its confidence interval? How do you interpret these values correctly? What do you think about the associated p-value?
Task 4
Going back to the PPV calculation write a function that parameterizes the percentage of true associations, the significance level and the power; and illustrate how the PPV depends on these three characteristics.
Submission
Add your Rmd file with the name Homework_03.Rmd to the homework folder of your personal git repository (https://gitlab.uzh.ch/open_science_course/hs22_dcas/username) used in the homework for last week. Also add the R packages you need for the analysis to the file packages.txt. Stage the files, commit and push.
- Push your Rmd file to Gitlab.
- Enter the corresponding Gitlab pages URL into the Open edX text box in the next unit.
Note: the URL will be of the form https://opensciencecourse.pages.uzh.ch/hs22_dcas/hs22_dcas/USERNAME_Homework_03.html, where USERNAME is your Gitlab user name. E.g for user jdoe: https://opensciencecourse.pages.uzh.ch/hs22_dcas/hs22_dcas/jdoe_Homework_03.html
Your submission on Open edX will be peer reviewed. Staff will perform random checks on the peer review.
Your submission on Gitlab will be automatically checked, points from the Open edX assessment may be decreased if your submission is not correct.
In-class tasks
Recall: Positive results
D Fanelli https://link.springer.com/article/10.1007/s11192-011-0494-7
In this class session we will explore how such statements as in the graph above can be made and we will look at some research indicating that registered reports may be a solution to the problem.
Task 1
Read the abstract and the sections “The Current Study”, “Sample”, “Measures and coding procedure” of “An Excess of Positive Results: Comparing the Standard Psychology Literature With Registered Reports” by A Scheel et al. https://journals.sagepub.com/doi/pdf/10.1177/25152459211007467
The preregistration of the study is available here: https://osf.io/sy927/
Download or pull the corresponding Github repository containing the data and analysis scripts: https://github.com/amscheel/positive_result_rates
Question 1 What are the two samples of publications that are assessed in the report and how were they obtained?
Question 2
Find the raw data and the corresponding codebook in the Github materials. What is the meaning of the variable support in the data sheet and what are its possible values?
Question 3 How did the authors obtain the value of the variable support from the publications in their sample?
Question 4 What is the main message of the publication by A Scheel et al.?
Task 2
Next we look at four publications from the samples in the report. We will form four ad hoc groups during class to do so. The publications we look at are:
Registered reports:
-
Online incidental statistical learning of audiovisual word sequences in adults: a registered report https://royalsocietypublishing.org/doi/pdf/10.1098/rsos.171678
-
Does volunteering improve well-being?
https://www.tandfonline.com/doi/full/10.1080/23743603.2016.1273647?journalCode=rrsp20
link to pdf
Question 1a Find the first preregistered hypothesis in the publication. Is it supported by the results?
Standard reports:
-
Young children’s knowledge about the links between writing and languag
https://doi.org/10.1017/S0142716416000503
link to pdf -
Overcome procrastination: Enhancing emotion regulation skills reduce procrastination https://www.sciencedirect.com/science/article/pii/S1041608016302187
Question 1b Find the first hypothesis (search phrase: test* the hypothes*) in the publication. Is it supported by the results?
Task 3 (optional, if time allows)
Test if you can reproduce the main analysis using the script 02_quantitative_analyses.R in the analysis folder.
Quiz/Open response assessment
Complete the quiz (within an open response assessment) in the next unit during the plenum discussion of Tasks 1 & 2
Key Points
tbd
by eva