First steps towards more reproducibility
Overview
Teaching: 60 min
Exercises: 90-120 minQuestions
Is there a reproducibility/replicability crisis?
How do I organize projects and software code to favor reproducibility?
How do I handle data in spreadsheets to favor reproducibility?
Objectives
Practice good habits in file and folder organization which favours reproducibiity
Practice good habits in data organization in spreadsheets which favour reproducibility
Some practical tips for the use of Rstudio (optional)
1. Is there a reproducibility/replicability crisis?
First, we will look at anecdotal and empirical evidence of issues with reproducibility/replicability in the scientific literature. Along the way we point to the pertinent of Markowetz’ five selfish reasons for working reproducibly. This episode hence gives some insight on the background and a few first practical tools for reproducible research practice.
Recall: Reproducibility vs Replicability
Reproducibility refers to the ability of a researcher to duplicate the results of a prior study using the same materials as were used by the original investigator. This requires, at minimum, the sharing of data sets, relevant metadata, analytical code, and related software.
Replicability refers to the ability of a researcher to duplicate the results of a prior study if the same procedures are followed but new data are collected.
See S Goodman et al.https://www.science.org/doi/10.1126/scitranslmed.aaf5027 for a finer grained discussion of the concepts.
Retracted Nature publication
See this example of a publication, W Huang et al. https://www.nature.com/articles/s41586-018-0311-z, published in the prestigious journal Nature, that had issues with replication:

The publication contains an important finding on how a special type of RNA can affect T-cells, which could imply therapeutic effects and lead to new drugs for autoimmune diseases. But some of the co-authors were unable to replicate the published results and hence initiated a retraction. The retraction note states:
“In follow-up experiments to this article, we have been unable to replicate key aspects of the original results.”
For more information, see the commentary on Retraction Watch.
⇒ Replication may be an issue for other published research results, here the authors themselves discovered it. See below for some concerted efforts to study replicability of published scientific results.
Selfish reason number 5: reproducibility helps to build your reputation
“Generally, making your analyses available in this way will help you to build a reputation for being an honest and careful researcher. Should there ever be a problem with one of your papers, you will be in a very good position to defend yourself and to show that you reported everything in good faith.”
F Markowetz https://genomebiology.biomedcentral.com/articles/10.1186/s13059-015-0850-7
Issues with reproducibility/replication affect many fields
Is retraction due to error or non-feasibility of replication rare? Attempts at replication of results become more frequent. For example, in some fields there have been concerted efforts of aiming to replicate larger sets of studies allowing to assess reliability of results on a wider scale.
Biomedicine
F Prinz et al. attempted “To substantiate our incidental observations that published reports are frequently not reproducible with quantitative data, we performed an analysis of our early (target identification and validation) in-house projects in our strategic research fields of oncology, women’s health and cardiovascular diseases that were performed over the past 4 years.” From 67 studies only 22 were fully or partially confirmed, see https://www.nature.com/articles/nrd3439-c1.

Psychology
The Open Science Collaboration in Psychology “conducted replications of 100 experimental and correlational studies published in three psychology journals using high-powered designs and original materials when available.” in an attempt to “Estimating the reproducibility of psychological science”. Only 39 of 100 replication studies were significant and the mean effect size was about 50% compared to the original studies, see https://www.science.org/doi/10.1126/science.aac4716.

Economics
C Camerer et al. replicated “18 studies published in the American Economic Review and the Quarterly Journal of Economics between 2011 and 2014. All of these replications followed predefined analysis plans that were made publicly available beforehand, and they all have a statistical power of at least 90% to detect the original effect size at the 5% significance level.” They found significant effects in 11 of 18 studies with a mean effect size of about 66% compared to the original studies, see https://www.science.org/doi/10.1126/science.aaf0918.

Social Sciences
Again C Camerer et al. “replicate 21 systematically selected experimental studies in the social sciences published in Nature and Science between 2010 and 2015.” They found significant effects in 13 of 21 studies with mean effect size about 50% compared to the original studies, see https://www.nature.com/articles/s41562-018-0399-z.

Selfish reason number 1: reproducibility helps to avoid disaster
“This experience showed me two things. First of all, a project is more than a beautiful result. You need to record in detail how you got there. And second, starting to work reproducibly early on will save you time later. We wasted years of our and our collaborators’ time by not being able to reproduce our own results. All of this could have been avoided by keeping better track of how the data and analyses evolved over time.”
F Markowetz https://genomebiology.biomedcentral.com/articles/10.1186/s13059-015-0850-7
1,500 scientists lift the lid on reproducibility
In 2016 M Baker designed a survey meant to shed “light on the ‘crisis’ rocking research.” Here we discuss some of the results of the survey, for a complete report see https://www.nature.com/articles/533452a. The two graphs reproduced from raw data of the publication show that a large proportion of researchers believes that there are issues with reproducibility but that, again in the opinion of researchers, the extent of the problem differs between disciplines. Specifically, researchers from the “hard” sciences such as chemistry and physics, more frequently believe that the published work in their field is reproducible than for example in the “softer” sciences biology and medicine.
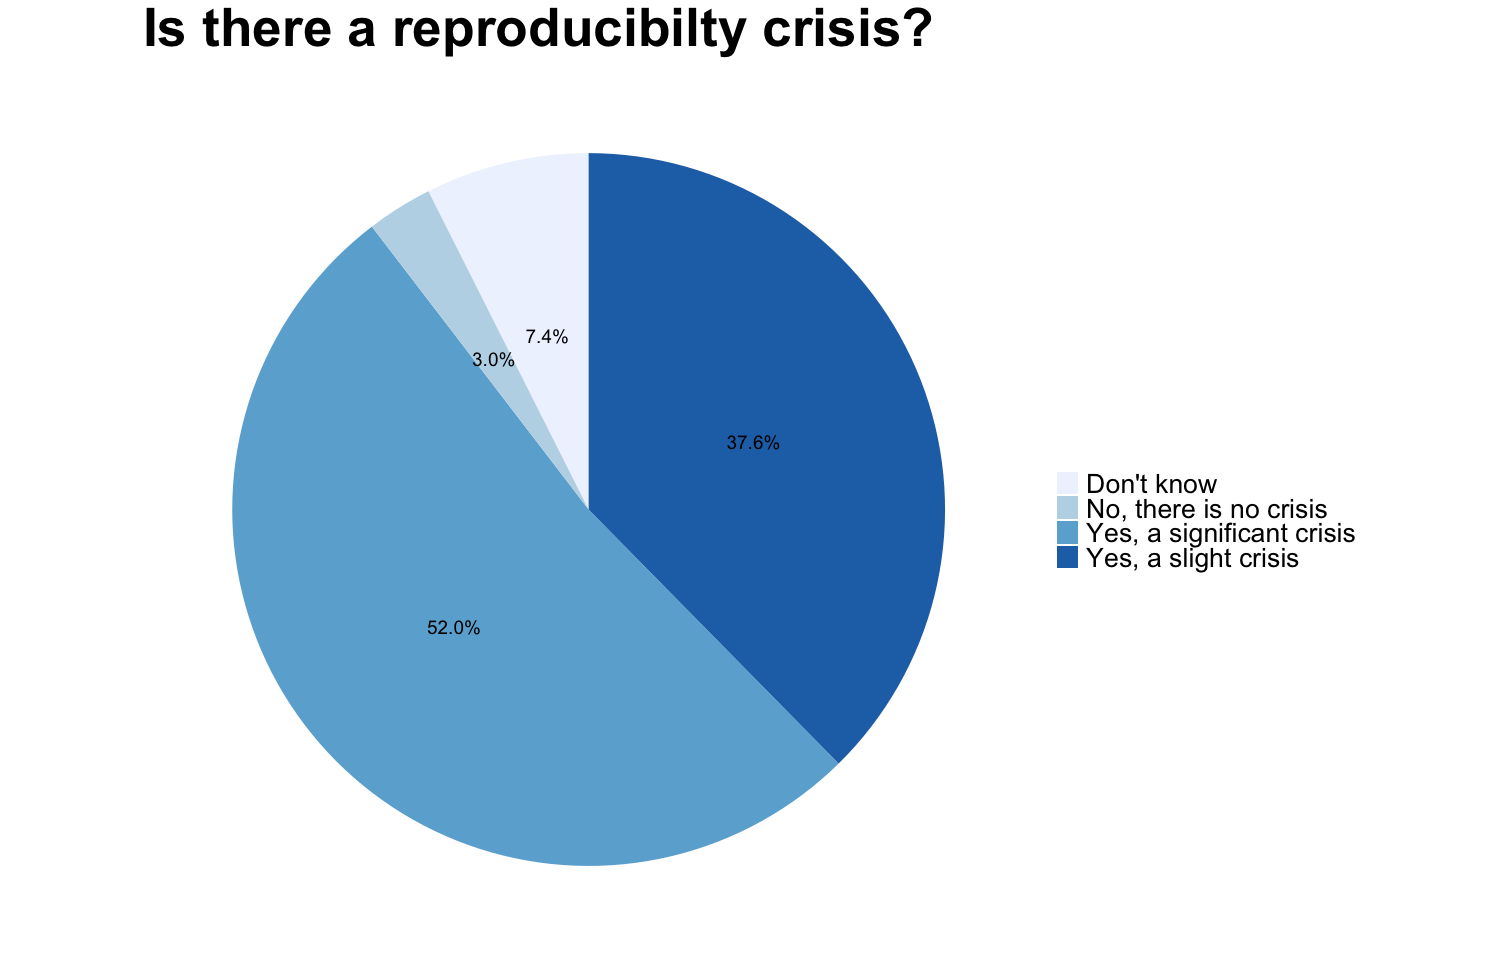
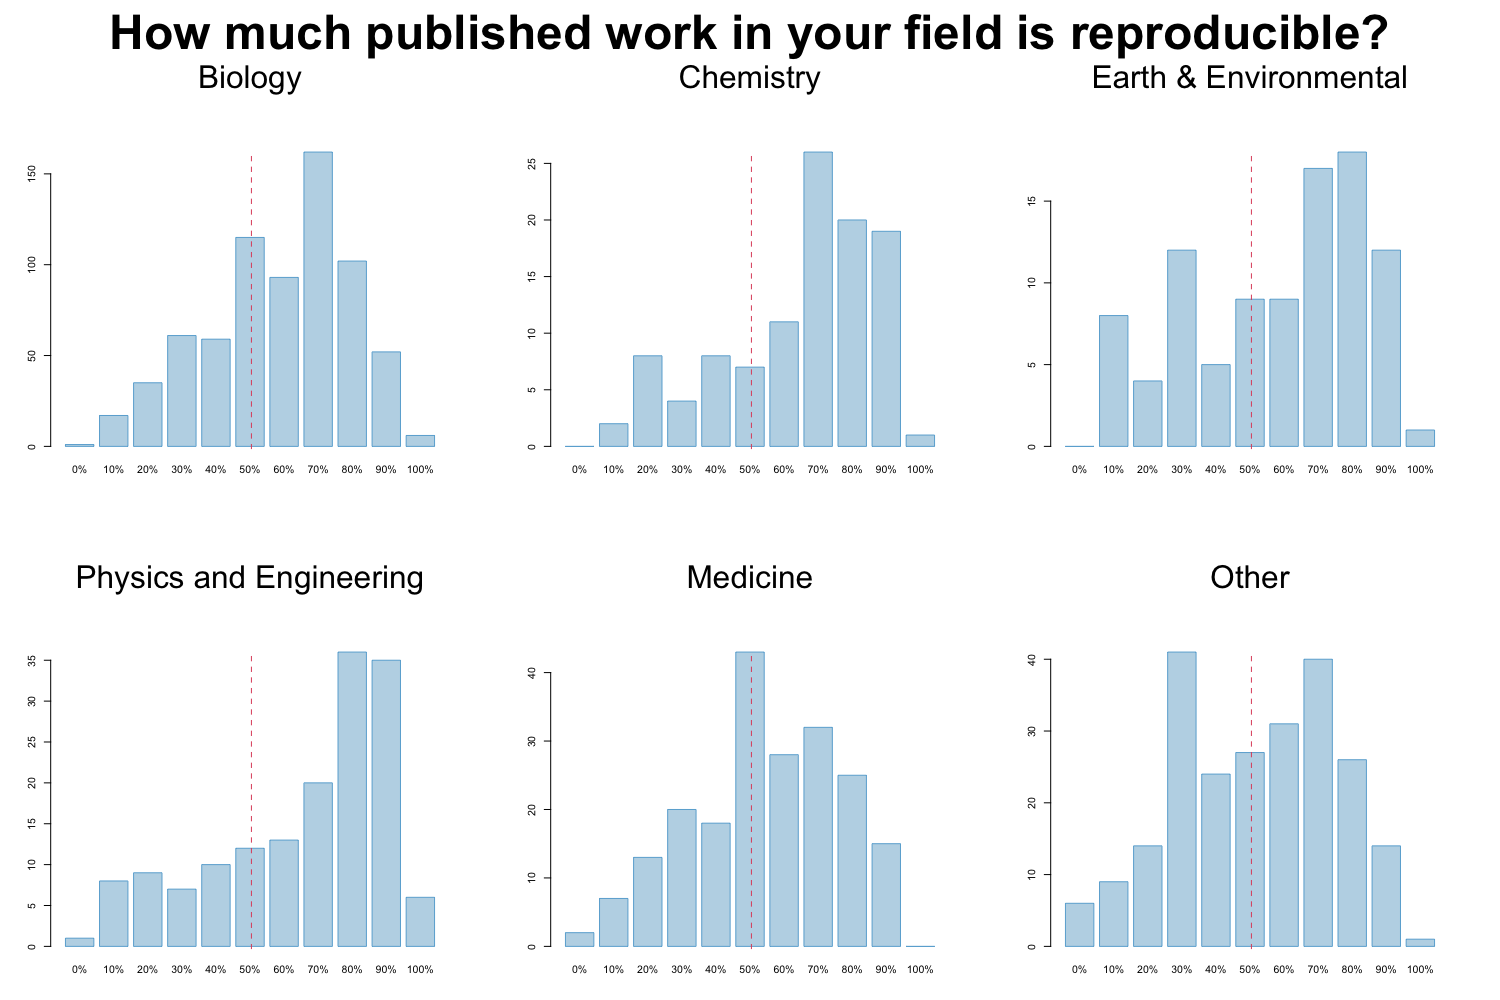
Image credit: Figures are reproduced from https://www.nature.com/articles/533452a with the data available on Figshare
Factors contributing to irreproducible research
Baker also tried to evaluate which factors could contribute to this perceived reproducibility issue. Most researchers (more than 95%) believe that selective reporting and pressure to publish always/often or sometimes contribute to irreproducibility. Still about 90% believe that low statistical power or poor analysis, not enough replication in the original lab and insufficient mentoring/oversight always/often or sometimes contribute. Around 80% agree with unavailability of methods/code, poor experimental design, unavailability of raw data and unsufficient peer review as contributing factors at least sometimes. Fraud plays a more minor role in the opinion of researchers.
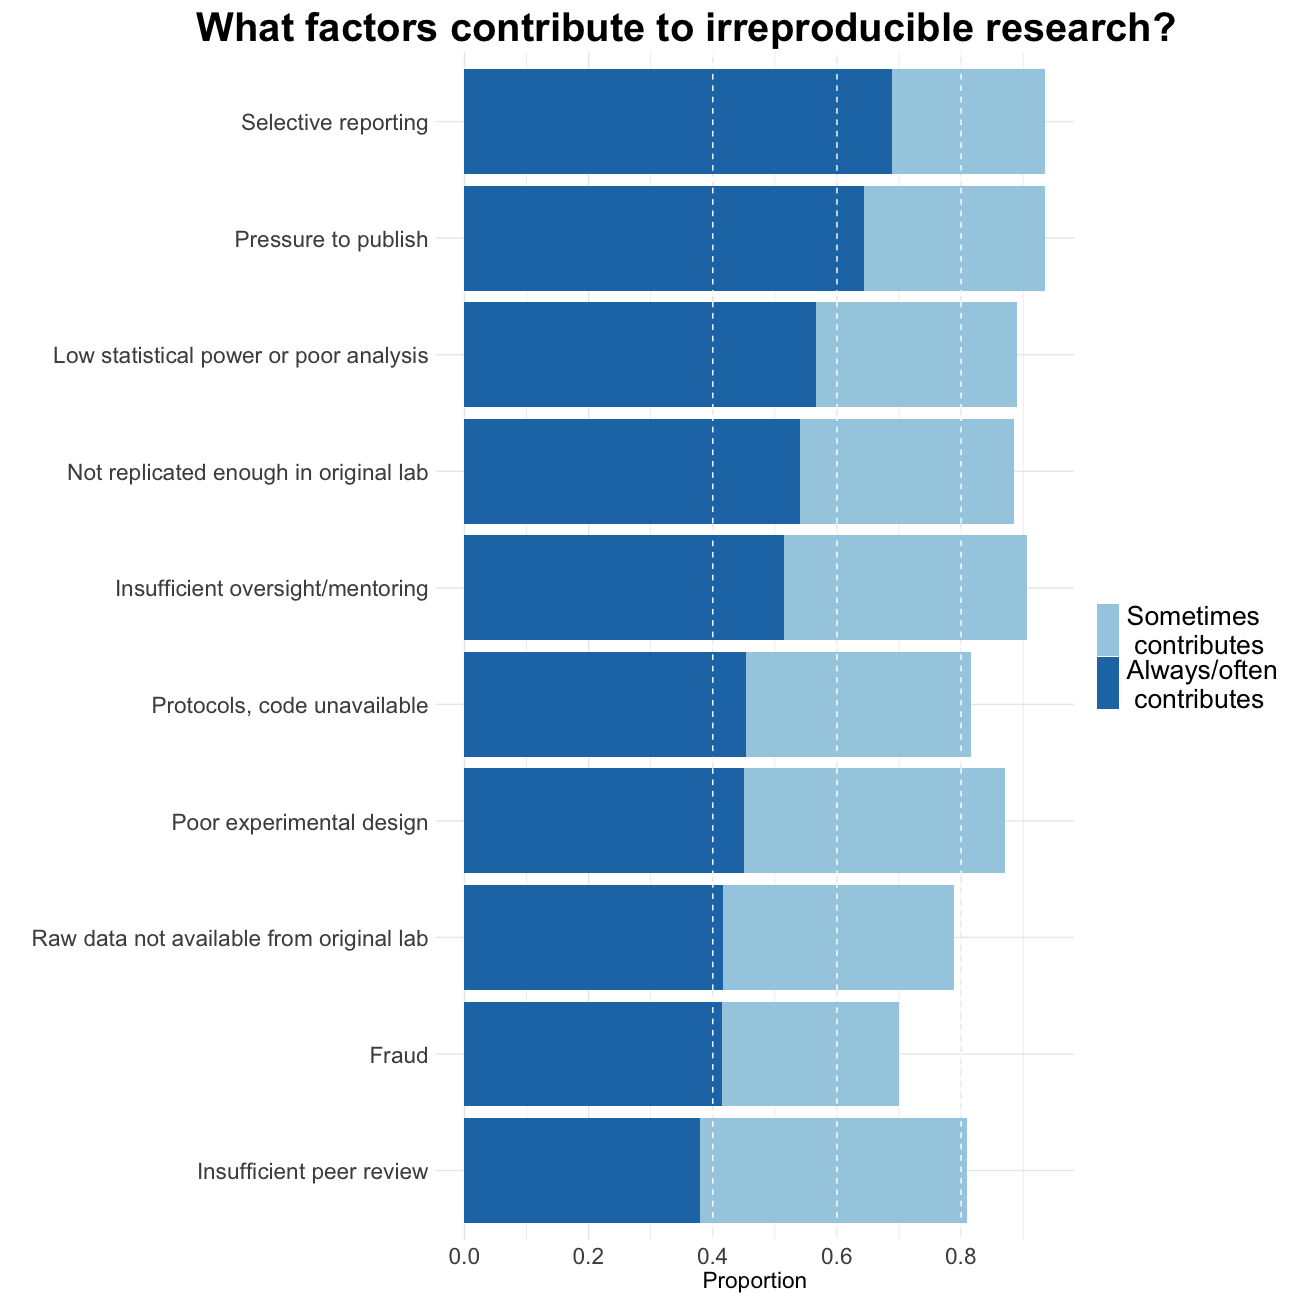
Image credit: Figures are reproduced from https://www.nature.com/articles/533452a with the data available on Figshare
Quiz on reproducibility/replicability
Effect size
Within the concerted replication efforts effect sizes of the replication attempts are on average (for one of them we do not have the information)
- smaller than the original effect
- approximately the same as the original effect
- bigger than the original effect
Solution
T smaller than the original effect
F approximately the same as the original effect F bigger than the original effect
Factors contributing to irreproducibility
Peeking at the content below, with which of the above factors that contribute to irreproducible research is the current episode of this course concerned?
Solution
Methods, code unavailable
2. Organization and software
In this section we learn about simple tools to avoid the fear in Markowetz’ selfish reason number 4.
Selfish reason number 4: reproducibility enables continuity of your work
“I did this analysis 6 months ago. Of course I can’t remember all the details after such a long time.”
F Markowetz https://genomebiology.biomedcentral.com/articles/10.1186/s13059-015-0850-7
Project organization
The main principles of data analytic project organization is the separation of
- data
- method
- output
and the preservation of the - computational environment
Project organization checklist
To achieve these principles make sure that you follow a procedure similar to:
- Put each project in its own directory named after the project.
- Put text associated documents in the
docdirectory.- Put raw data and metadata in a
datadirectory and files generated during cleanup and analysis in aresultsdirectory.- Put project source code in the
srcdirectory.- Put external scripts or compiled programs in the
bindirectory.- Name all files to reflect their content or function.
From Good enough practices in scientific computing by G Wilson et al. https://journals.plos.org/ploscompbiol/article?id=10.1371/journal.pcbi.1005510
In Packaging Data Analytical Work Reproducibly Using R (and Friends) B Marwick et al. https://www.tandfonline.com/doi/full/10.1080/00031305.2017.1375986 suggest a slightly different but conceptually similar approach. They propose to organize projects as so-called “research compendia”, for example like:
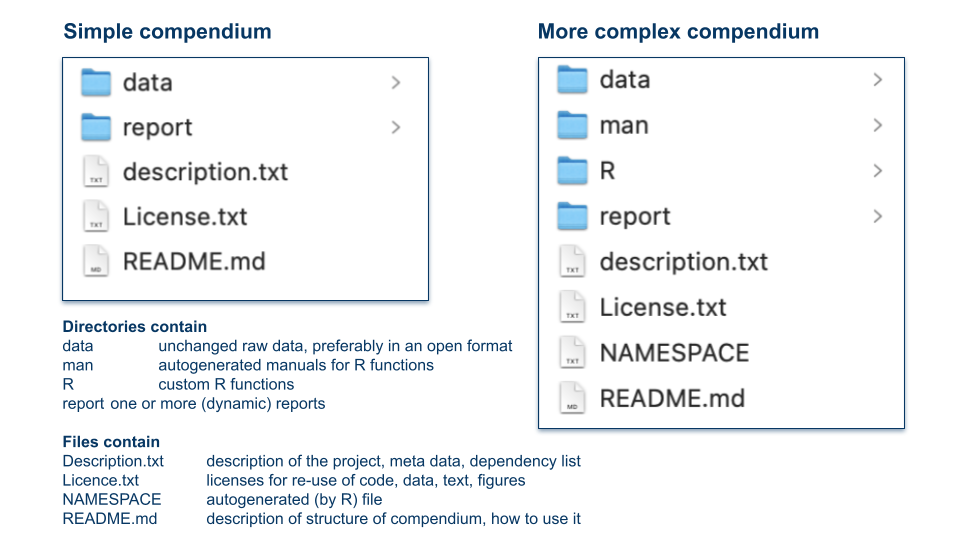
Image credit: Illustration of research compendia as suggested in B. Marwick et al. by Eva Furrer, CC-BY, https://doi.org/10.5281/zenodo.7994355.
Software/code
Writing code for a data analysis instead of using a GUI based tool makes an analysis to some degree reproducible (given the availability of the data and the analogous functioning of the computing environment). But code can also be a very detailed documentation of the employed methods, at least if it is written in a way such that it is understandable.
Selfish reason number 3: reproducibility helps reviewers see it your way
“One of the reviewers proposed a slight change to some analyses, and because he had access to the complete analysis, he could directly try out his ideas on our data and see how the results changed.”
F Markowetz https://genomebiology.biomedcentral.com/articles/10.1186/s13059-015-0850-7
Code understandability checklist
Use the following principles that make code easier to understand and use by others and your future self
- Place a brief explanatory comment at the start of every program.
- Decompose programs into functions.
- Be ruthless about eliminating duplication.
- Search for well-maintained libraries that do what you need.
- Test libraries before relying on them.
- Give functions and variables meaningful names.
- Make dependencies and requirements explicit.
- Do not comment and uncomment code sections to control behavior.
- Provide a simple example or test data set.
⇒ Your main goal with these principles is for your code to be readable, reusable, testable
From G Wilson et al. https://journals.plos.org/ploscompbiol/article?id=10.1371/journal.pcbi.1005510
On top of these high level recommendations writing and reading code is easier if one adheres to some styling rules. We have assembled our ten most important rules for code styling in R, these were influenced by https://style.tidyverse.org, https://google.github.io/styleguide/Rguide.html, https://cfss.uchicago.edu/notes/style-guide/ and by lot of experience in reading code by others and our past selves.
10 Rules for code styling (in R)
- Code styling is about readability not about correctness. The most important factor for readability is consistency which also increases writing efficiency.
- Use white space for readability, spaces around operators (e.g. +), after commas and before %>%, line breaks before each command and after each %>%.
- Control the length of your code lines to be about 80 characters. Short statements, even loops etc, can be a single line.
- Indent your code consistently, the preferred way of indentation are two spaces.
- Use concise and informative variable names, do not use spaces, link by underscore or use CamelCase. Avoid names, that are already used, e.g.,
mean,c.- Comment your code such that its structure is visible and findable (use code folding in RStudio).
- Do not use the equal sign for assignment in R, <- is the appropriate operator for this. Avoid right-hand assignment, ->, since it deteriorates readability.
- Curly braces are a crucial programming tool in R. The opening { should be the last character on the line, the closing } the first (and last) on the line.
- File naming is part of good programming style. Do not use spaces or non-standard characters, use consistent and informative names.
- Finally, do use the assistance provided by RStudio: command/control + i and shift + command/ctrl + A.
Quiz on organization and software
Duplication
Which of the following situations are meant by the principle “be ruthless about duplication”
- Copy-pasting code for several cases of the same type of calculation
- Several lines of code that are repeated at different locations in a larger script
- The duplication of statistical results with two approaches
- The same type of graph used for several cases
Solution
T Copy-pasting code for several cases of the same type of calculation
T Several lines of code that are repeated at different locations in a larger script
F The duplication of statistical results with two approaches
F The same type of graph used for several cases
Directories
Which directories would you use for cleaned data files of .csv format?
- results
- data
- doc
- results/cleaneddata
Solution
T results
F data
F doc
T results/cleaneddata
3. Data in spreadsheets
Selfish reason number 2: reproducibility makes it easier to write papers
“Transparency in your analysis makes writing papers much easier. For example, in a dynamic document (Box 1) all results automatically update when the data are changed. You can be confident your numbers, figures and tables are up-to-date. Additionally, transparent analyses are more engaging, more eyes can look over them and it is much easier to spot mistakes.”
F Markowetz https://genomebiology.biomedcentral.com/articles/10.1186/s13059-015-0850-7

Image credit: Randall Munroe/xkcd at https://xkcd.com/2180/ licensed as CC BY-NC.
Humor aside, spreadsheets have advantages and disadvantages, that can threaten reproducibility. But they are easy to use and so widespread that we better learn how to use them properly. And indeed data in spreadsheets can be organized in a way that favors reproducibility. We will summarize the recommendations of the article by K Broman and K Woo https://www.tandfonline.com/doi/full/10.1080/00031305.2017.1375989 into five checklists below. Broman and Woo promise that:
“By following this advice, researchers will create spreadsheets that are less error-prone, easier for computers to process, and easier to share with collaborators and the public. Spreadsheets that adhere to our recommendations will work well with the tidy tools and reproducible methods described elsewhere in this collection and will form the basis of a robust and reproducible analytic workflow.”
Spreadsheet consistency checklist
- Use consistent codes for categorical variables.
- Use a consistent fixed code for any missing values.
- Use consistent variable names.
- Use consistent subject identifiers.
- Use a consistent data layout in multiple files.
- Use consistent file names.
- Use a consistent format for all dates.
- Use consistent phrases in your notes.
- Be careful about extra spaces within cells.
Image credit: Image credit: copyright 2023, William F. Hertha under Creative Commons Attribution-NonCommercial-NoDerivatives 4.0 International License.
Choose good names for files and variables checklist
- No spaces
- Use underscores or hyphens or periods (only one of them)
- No special characters (&,*,%,ü,ä,ö,…)
- Use a unique, short but meaningful name
- Variable names have to start with a letter
- File names: include zero-padded version number, e.g. V013
- File names: include consistent date, e.g. YYYYMMDD
Be careful with dates checklist
- Use the ISO 8601 global standard
- Convention for dates in Excel is different on Windows and Mac computers
- Dates have an internal numerical representation
- Best to declare date columns as text, but only works prospectively
- Consider separate year, month, day columns
 Image credit: Randall Munroe/xkcd at https://xkcd.com/1179/ licensed as CC BY-NC.
Make your data truly readable and rectangular checklist
- Put one information of the same form per cell
- Do not add remarks in cells which should contain numerical values, e.g. >10000
- Include one variable per column, one row per subject: a rectangle of data
- Use the first and only the first row for variable names
- Do not calculate means, standard deviations etc in the last row
- Do not color, highlight or merge cells to codify information
- Use data validation at data entry
- Be careful with commas since they may be decimal separators
- Consider write protecting a file at the end of data collection
Code book/data dictionary checklist
- Create a code book in a separate sheet or file
Code book contains
- a short description
- unit and max/min values for continuous variables
- all levels with their code for categorical variables
- ordering for ordinal variables
- All variables have to be contained in the code book
Quiz on data in spreadsheets
Variable names
What are good names for the variable containing average height per age class?
- averageheightperageclass
- av_height_agecls
- height/class
- av_height
Solution
F averageheightperageclass
T av_height_agecls
F height/class
F av_height
Ruthlessness
Choose how to best initialize the variables that contain the BMI (body mass index) of 17 subjects at three different time points.
- bmi1 <- numeric(17); bmi2 <- numeric(17); bmi3 <- numeric(17)
- bmi <- matrix(0, nrow=17, ncol=3)
- bmi <- NULL; ind <- c(0,0,0); for (i in 1:17) bmi <- rbind(bmi, ind)
Solution
F bmi1 <- numeric(17); bmi2 <- numeric(17); bmi3 <- numeric(17)
T bmi <- matrix(0, nrow=17, ncol=3)
F bmi <- NULL; ind <- c(0,0,0); for (i in 1:17) bmi <- rbind(bmi, ind)
Special care for dates
This episode was created on February 28, 2023. Enter this date as an 8-digit integer:
Solution
20230228
Once more dates
This episode was created on February 28, 2023. Enter this date in ISO 8601 coding:
Solution
2023-02-28
Missing values
Choose all acceptable codes for missing values.
- 99999
- -99999
- NA
- ‘empty cell’
- non detectable
Solution
F 99999
F -99999
T NA
T ‘empty cell’
F non detectable
Code styling
The preferred way of indenting code is
- a tab
- none
- two spaces
Solution
F a tab
F none
T two spaces
Episode challenge
Improve a spreadsheet in Excel
Considering the input on data in spreadsheets try to improve the spreadsheet
This spreadsheet contains data from 482 patients, two columns with dates and 8 columns with counts of two different markers in the blood on a baseline date, on day 1, 2 and 3 of a certain therapy.
Specifically you should check
- the plausibility of all observations (e.g. value in correct range)
- the correct and consistent format of the entries, e.g. spelling or encoding errors
- date formats
- the format of missing values
- variable names
- the overall layout of the spreadsheet (header, merged cells, entries that are not observations etc.)
Solution
No solution provided here.
Improve a spreadsheet in R
We continue to work on the spreadsheet trainingdata.xlsx. This time we use
Rto correct the same errors in the spreadsheet. Why do you think is it better to use R for this process?
Solution
No solution provided here.
Key Points
Well organized projects are easier to reproduce
Consistency is the most important principle for coding analyses and for preparing data
Transparency increases reliability and trust and also helps my future self